Is your solar kit worth it, and how soon?

💰 Your solar kit
How long before a panel and a station pay for themselves in electricity you no longer buy? Pick a panel and a station from our catalogue, or enter your own figures.
Click a dot on the map to change location. The colour shows the average sunlight over the year. With a keyboard, the arrow keys move from one region to the next.
Panels oversized for this station (power and/or current): only 750 W out of the 800 W installed will be used. The figures below already account for this.
Estimate: daily output = total power (Wp) × equivalent sun hours × 0.70 (the yield used for a nomadic panel, poorly angled and without solar tracking, outside the scope of an optimised fixed installation). Sun hours and the electricity price are market averages, to be adjusted to your region and utility. Calculation horizon fixed at 10 years.
Sunlight: horizontal irradiation from NASA POWER (satellite/reanalysis climatology, multi-year average), 18 representative US locations. Electricity price: U.S. Energy Information Administration (EIA), national residential average, September 2026 (actual rates vary widely by state).
With a single panel, only 10.8% of catalogue combinations pay back within 10 years. That climbs to 20.7% with 2 panels, 29.3% with 3, and 35.4% with 4: scaling up spreads the station's fixed price further.
Ready-made profitable pairs
A selection of well-rated panels and stations (4.0/5 or above), physically compatible (solar input respected) and profitable within 10 years.
| Panel | Qty | Station | Payback | |||
|---|---|---|---|---|---|---|
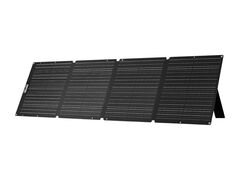 | Allpowers Solax SE200 | ×4 | 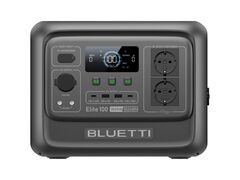 | Bluetti Elite 100 V2 | 7.2 years | Pre-fill |
| Allpowers Solax SE200 | ×3 | 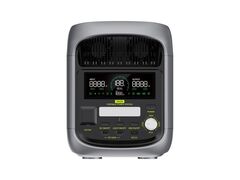 | Fossibot F1800 | 8.4 years | Pre-fill |
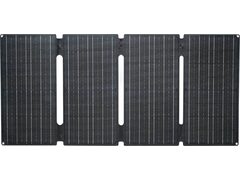 | Allpowers Solax SE60 | ×3 | 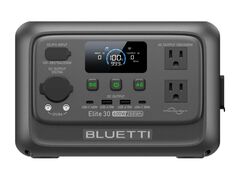 | Bluetti Elite 30 V2 | 10+ years (12.9 years) | Pre-fill |
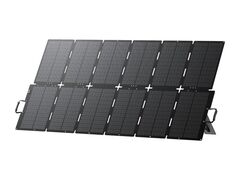 | Bluetti SORA 500 | ×1 | | Fossibot F1800 | 10+ years (12.9 years) | Pre-fill |
| Allpowers Solax SE60 | ×2 | 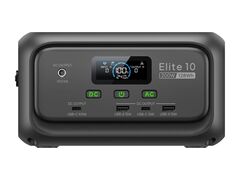 | Bluetti Elite 10 | 10+ years (13.0 years) | Pre-fill |
| Bluetti SORA 500 | ×3 | 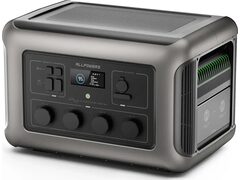 | Allpowers R3500 | 10+ years (13.7 years) | Pre-fill |
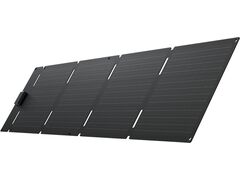 | EcoFlow 60W solar panel | ×3 | | Bluetti Elite 30 V2 | 15+ years | Pre-fill |
| EcoFlow 60W solar panel | ×2 | | Bluetti Elite 10 | 15+ years | Pre-fill |